Fall 2025 Undergraduates by the Numbers: Lawrence/Edwards Campuses
Student Population
27,212
Total Students
21,964
Undergraduate Students
Student Population
62.01%
Kansas Residents
37.99%
Non-Residents
53.27%
Female
46.64%
Male
Transfer Students
|
First-Time Freshmen
|
Retention Numbers
|
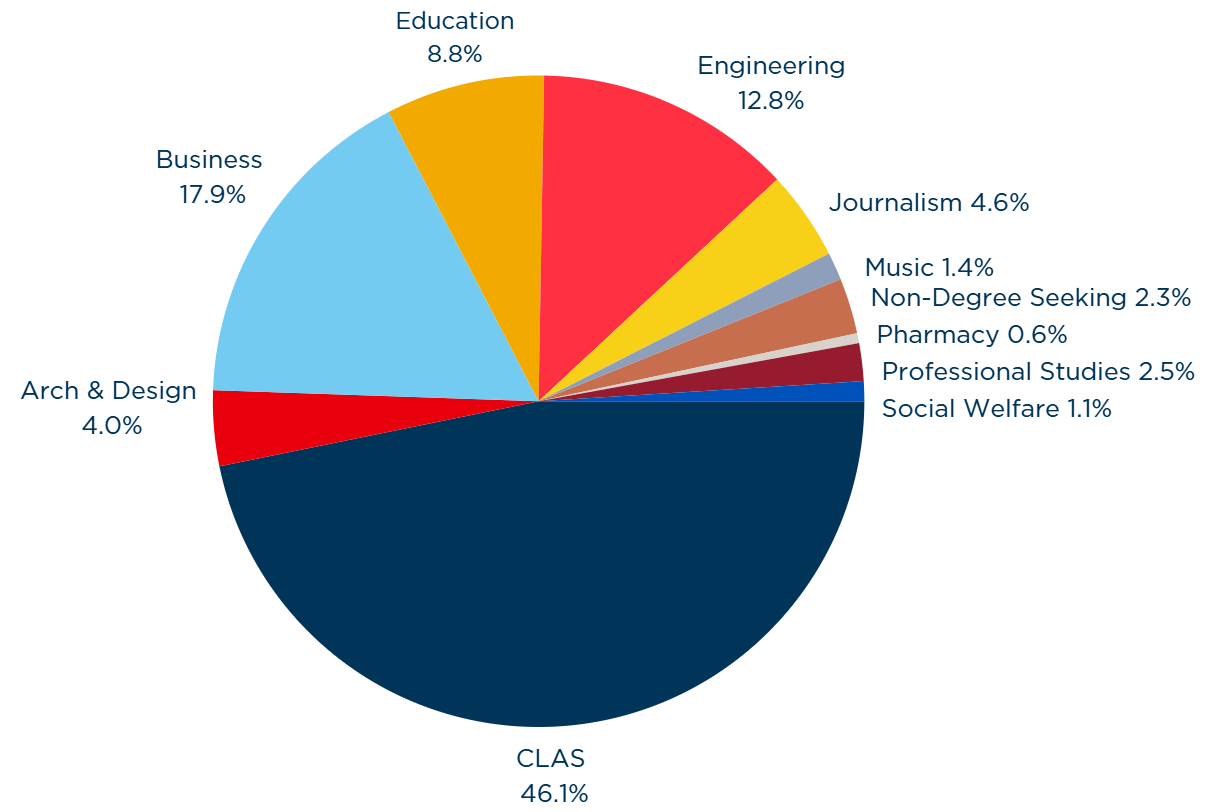
Undergraduate Enrollment by Program
|
First-Generation Students
|
Military-Affiliated Students
| |
Other Important Highlights
|
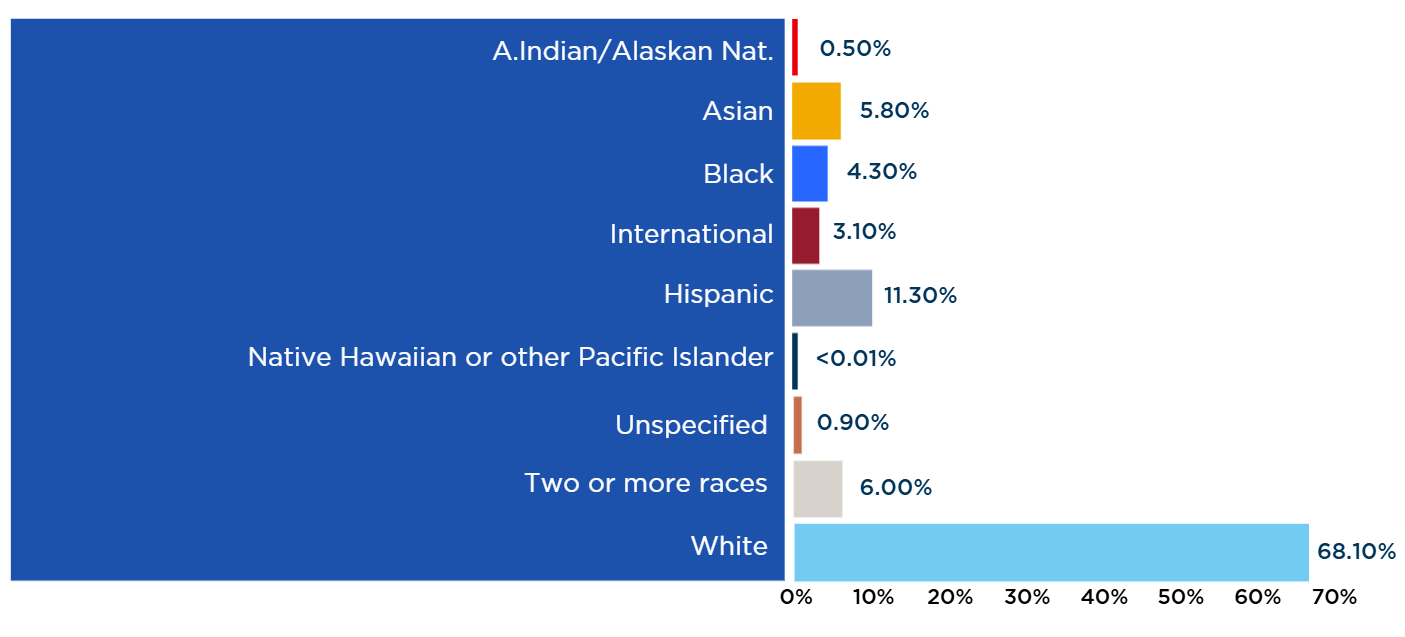
Undergraduate Enrollment by Race/Ethnicity
|