Fall 2025 Graduate Students by the Numbers: Lawrence/Edwards Campuses
Student Population
27,212
Total Students
5,248
Graduate Students
Student Population
40.15%
Kansas Residents
59.85%
Non-Residents
54.31%
Female
45.1%
Male
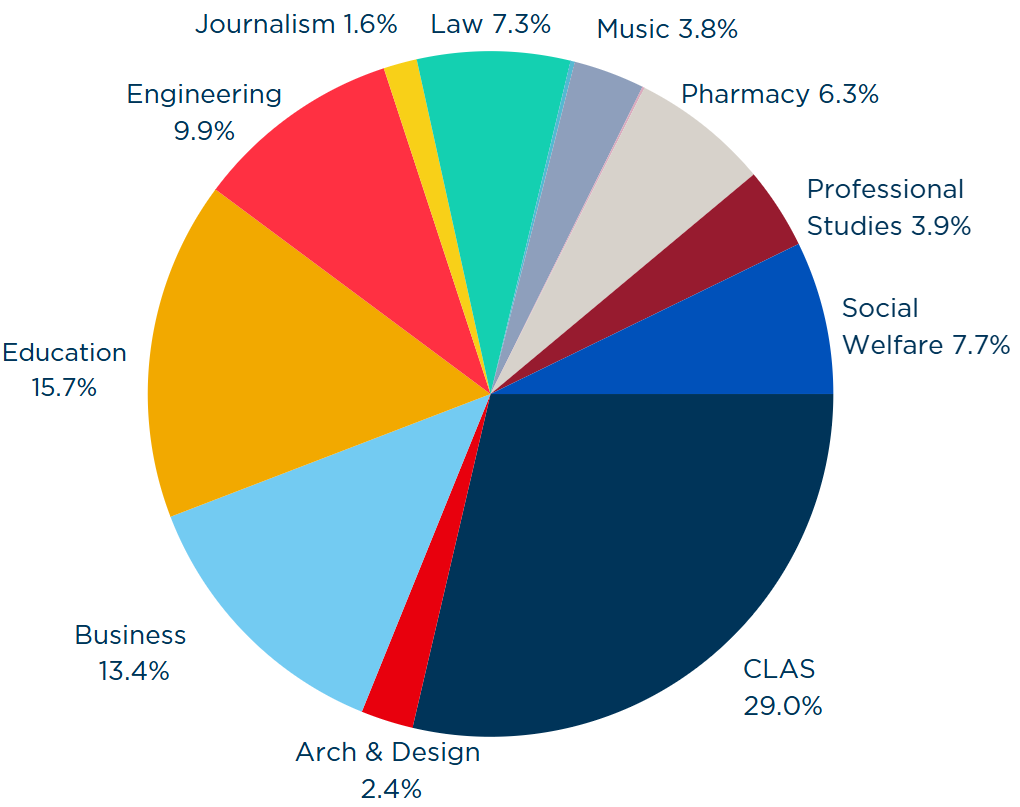
Graduate Enrollment by Program
|
Military-Affiliated Students
|
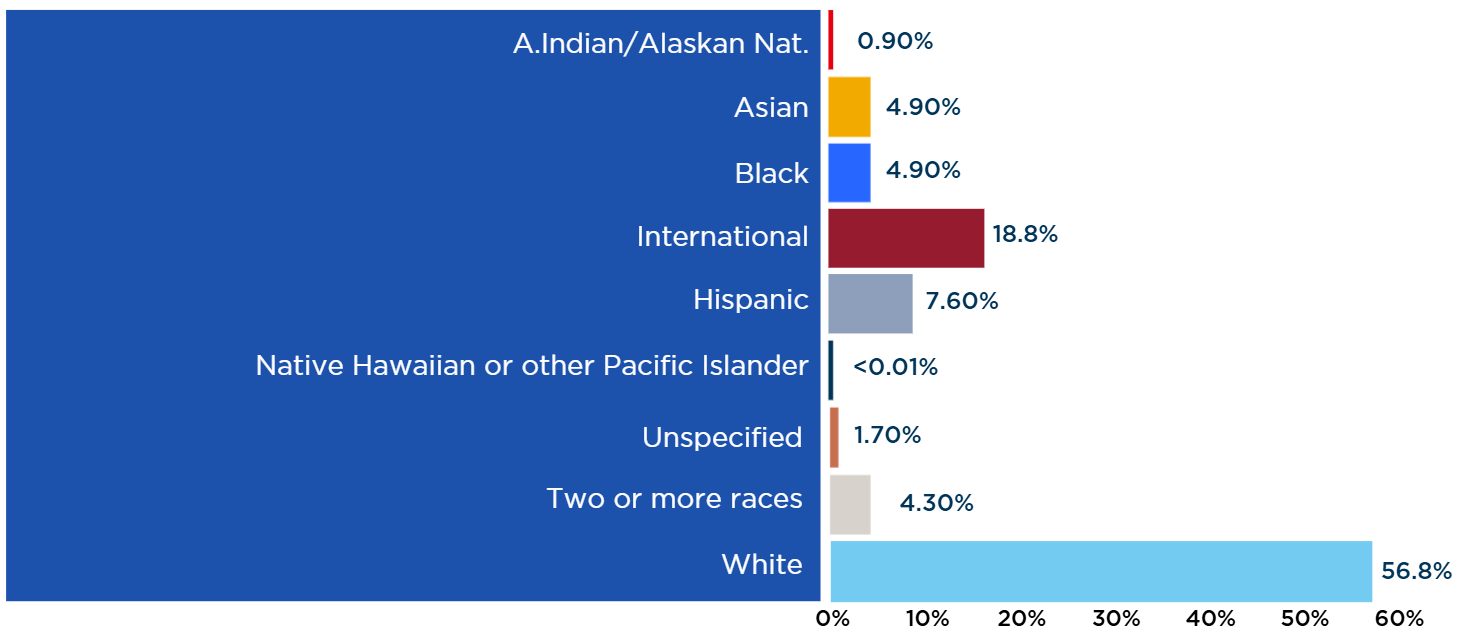
Graduate Enrollment by Race/Ethnicity
|